Off grid battery power supplies have been used for many years, some were professional systems but many were a DIY affair.
Today, with the availability of relatively cheap solar and wind generation, off grid power is a blooming industry with millions of dollars being spent on research into power sources, batteries, battery management systems and charging.
Many people, particularly for leisure pursuits, still use relatively simple systems to charge their batteries, usually from solar or mains supplies.
There are many types of battery charger on the market, however a stand-alone leisure battery charger is likely to be what is described as a “smart charger”.
Most smart charger manufactures use and specify the standard charging algorithm (IUoU) originally specified in DIN 41773 back in 1979, but for the non-specialist this can be difficult to interpret.
A tiny bit of theory to begin:
Batteries are rated in Amp hours (Ah) usually at the 20 hour rate, for example a 100Ah battery could be expected to give 5 Amps for 20 hours. This is not a fixed value, it will vary depending on the actual current drawn. The Ah rating should not be confused with the maximum current rating. Our 100Ah battery may have a maximum current rating of say 600A.
In order to charge our 100Ah battery we need to use an external power supply to give somewhat more than 100Ah worth of charge (because the battery is less than 100% efficient).
There are many types of power supply on the market but they are all variations on the two basic configurations, constant voltage and constant current.
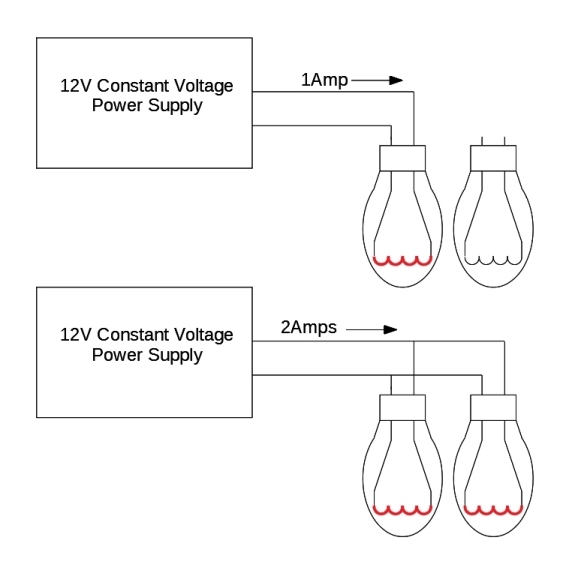
This is the usual type of power supply that most people are familiar with. The voltage remains constant and the current changes as more items are added or removed. In the extreme, if too much current is drawn a fuse will (hopefully) blow.
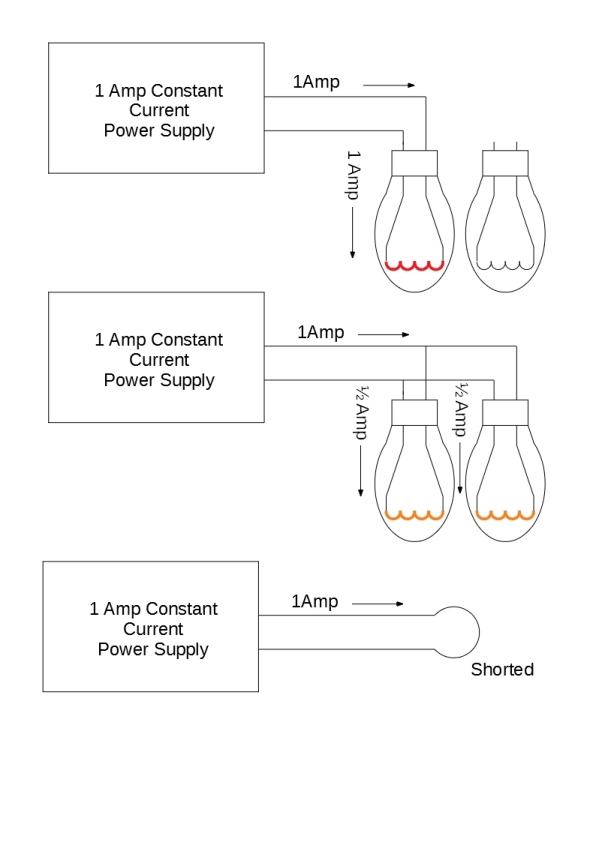
This is a lesser known but quite common type of power supply where the current remains constant and the voltage varies as loads are added or removed. In the extreme; if for example the power supply is “shorted” with a piece of wire, the voltage will fall to very close to zero but the current will remain at 1 Amp. The voltage output of a constant current power supply depends entirely on the load.
It is not possible to overload a properly designed constant current power supply, even with a short circuit on the output it will still give 1A. It is possible to “under-load” it but this is not normally damaging and we will not go into it here.
Many commercial power supply units are a combination of the two and can switch between modes, for example, if maximum current is being drawn from a constant voltage power supply it may switch to constant current mode and simply maintain its maximum current, avoiding any possibility of a blown fuse. This feature is usually given in the specification as a “Current Limit”.
Constant Voltage
Constant Current
Although lithium based batteries are taking over in almost all applications lead acid is likely to be around for a few years yet. This document aims to give a simple description of lead acid smart charger operation for single and parallel battery combinations using measurements taken during an actual charge / discharge cycle as an example.
In this demonstration, two batteries were used and deliberately mismatched, they were different makes, different capacities and different ages.
To make the test time and currents manageable a pair of small VRLA batteries were used but the theory is general and the results can be scaled up to cover the majority of single and parallel lead acid battery combinations.
The two batteries were, a Fiamm FG20721 12V 7.2 Ah about three years old and a Yuasa NP4-12 12V 4 Ah about 6 months old. Both batteries had spent most of their life on float before this test.
The charger was a Yuasa commercial 1.5A (1500mA) smart charger.
Intelligent Lead Acid Battery Charging for an
Off-Grid Power Supply
Author:
Brod Colbourne BSc (Hons) MIET
November 2017
Reviewed by:
David Brown MEng BEng CEng MIET
Off-Grid Power Supply
Author:
Brod Colbourne BSc (Hons) MIET
November 2017
Reviewed by:
David Brown MEng BEng CEng MIET
Now back to a test to show how the charge and discharge cycle works.
The wiring is shown in fig 1 and the setup consists of:
Two 12V batteries (as described above).
A constant current drain to discharge the batteries at a steady rate (about 880mA)1.
A standard 1.5A Yuasa commercial smart charger (1500mA).
A controller / recorder to measure current and voltage and switch the batteries from discharge to charge when necessary.
The recorder was taking measurements every 125 milliseconds throughout the test
Both batteries begin in a fully charged state. The controller initially connects the constant current drain to the batteries and measures
the current and terminal voltage. When the terminal voltage falls to 10.5V the constant current drain is automatically switched off and
the charger switched on.
Note: It is not recommended to discharge a lead acid battery to this level in normal use, doing so will seriously reduce the service life
of the battery.
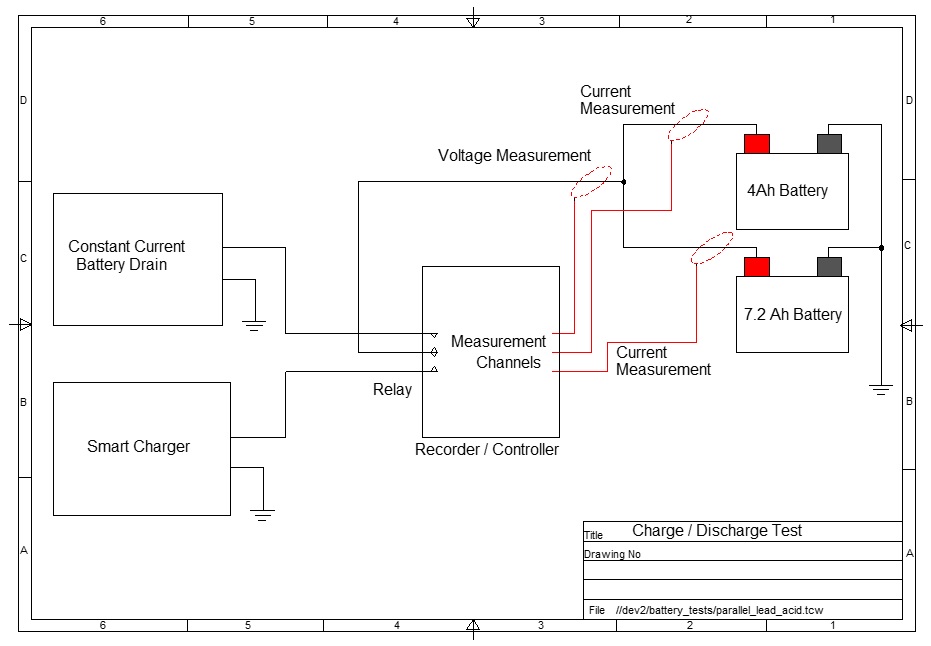
Fig 1 Wiring Schematic
The Charge and Discharge Curves
4Ah Battery
Fig 2 shows operation of the smart charger using the 4Ah battery going through the charge /discharge sequence as an example. The numbered stages are indicated in Fig2.
The scale on the left-hand side (blue) shows the battery current and on the right-hand side (red) the battery voltage. On the current side zero is just under half scale so a negative figure represents a discharge current and a positive figure represents a charge current.
1) Starting with a fully charged battery a load is connected and left on until the battery voltage drops to 10.5 Volts.
2) At this point the load is disconnected and the charger switched on. The charger starts up in constant current mode and “injects” a steady 1.5 Amps and you can see the battery voltage rising as it charges.
3) This constant current phase lasts for about 2½ hours. When the battery voltage reaches 14.5V, the battery is approaching full charge. The charger detects this and comes out of constant current mode and into constant voltage mode.
4) At this point the charger maintains 14.5V while monitoring the battery current. As the battery comes up to full charge the current falls. Despite what you may read in some manufacturers advertising literature the fall in current is a function of the battery as it approaches full charge and not due to any “clever” functionality in the charger.
5) When the charging current falls to a predetermined level the charger switches to “float” mode meaning that it simply maintains the battery terminals at the fully charged voltage. The current falls to a very low level. Very little energy is going into the battery and it can be left in this state for long periods without damage.
The current in float mode is that needed to compensate for self-discharge. Again, this is a function of the battery itself and despite some manufacturers claims not a function of the charger (other than the setting of the float voltage level).
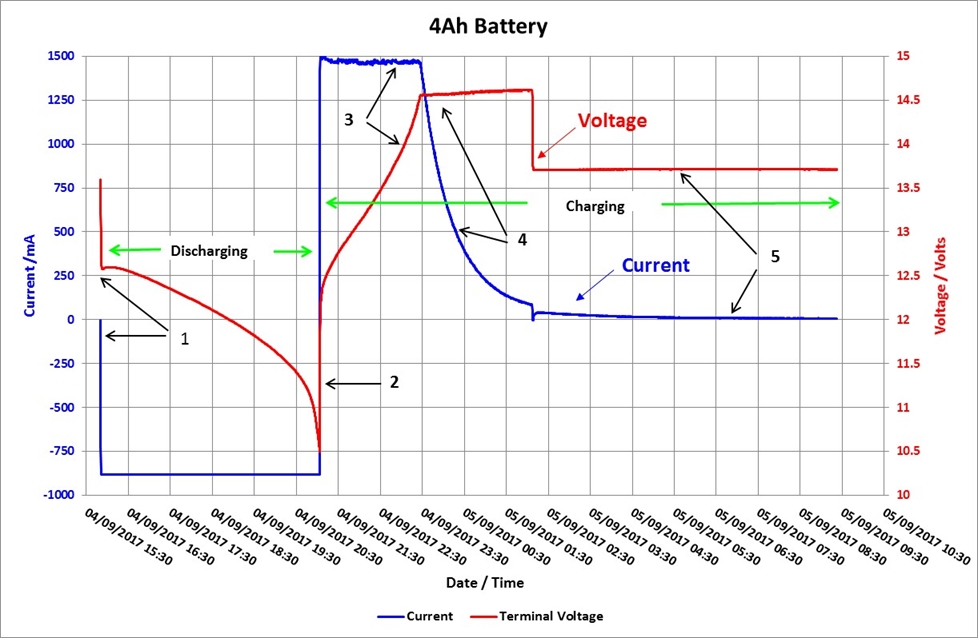
Fig 2 The 4Ah battery going through the discharge/charge sequence
7.2Ah Battery
Fig 3 shows the 7.2Ah battery going through the same charge /discharge sequence. It requires no further explanation; the points are the same as those shown in fig 4.
In this case the discharge time is longer (as expected) and the constant current charging phase lasts for about 4 hours. Apart from that the charging sequence is identical.
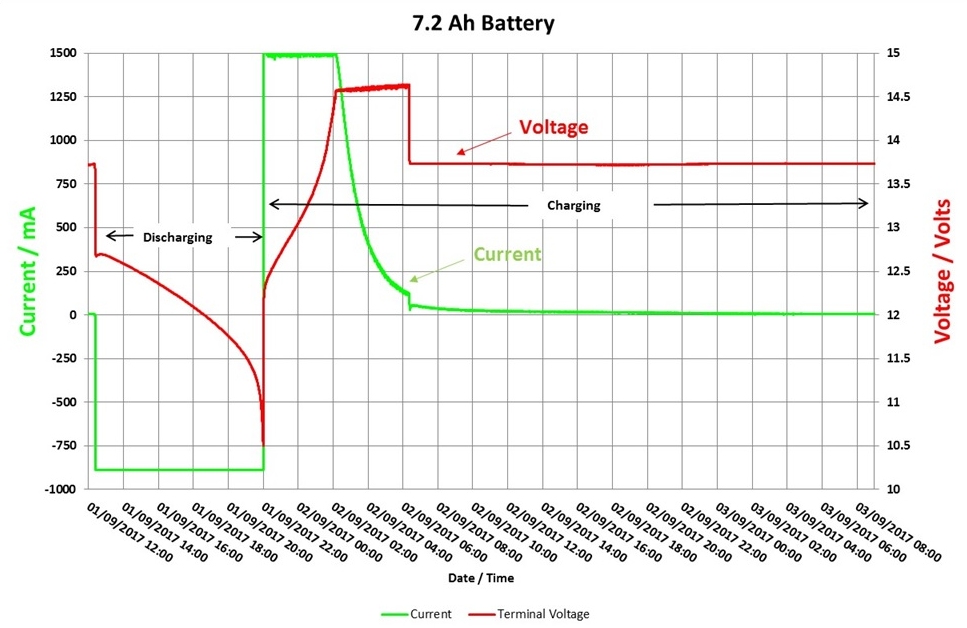
Fig 3 The 7.2 Ah battery going through the discharge /charge sequence

Charging and Discharging in Parallel
It is very common practice to connect multiple batteries in parallel to increase battery capacity.
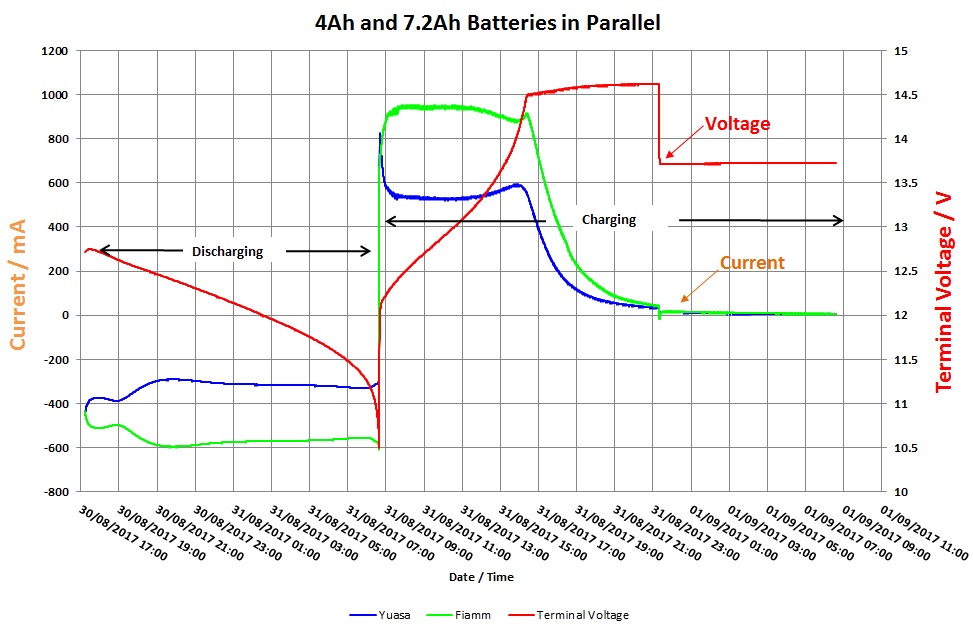
The test is repeated with the two batteries connected in parrallel. Fig 4 shows the results. During the discharge period both batteries begin by taking half the load current but as the system stabilizes they take a share roughly in proportion to their capacity.
When the charging phase starts the charger again injects 1.5A into the system. This time the charge current is again shared between batteries at a level roughly proportional to their capacity
It is very common practice to connect multiple batteries in parallel to increase battery capacity.
The test is repeated with the two batteries connected in parrallel. Fig 4 shows the results. During the discharge period both batteries begin by taking half the load current but as the system stabilizes they take a share roughly in proportion to their capacity.
When the charging phase starts the charger again injects 1.5A into the system. This time the charge current is again shared between batteries at a level roughly proportional to their capacity
Fig 4 The parallel pair going through the discharge /charge sequence
to confirm the constant current operation, fig 5 shows the same data as the graph in fig 4 but with the two (i.e. green and blue) current traces added to show the total current. The result is exactly what you would expect from a single, battery, and shows slightly more than the expected 11.2 Ah (see section 4 Conclusions). Apart from the expected longer discharge and charge times the curve is identical to that of a single battery as shown in figs 2 and 3.
So as far as the user and the charger are concerned the parallel pair work in the same way as a single larger capacity battery.
So as far as the user and the charger are concerned the parallel pair work in the same way as a single larger capacity battery.
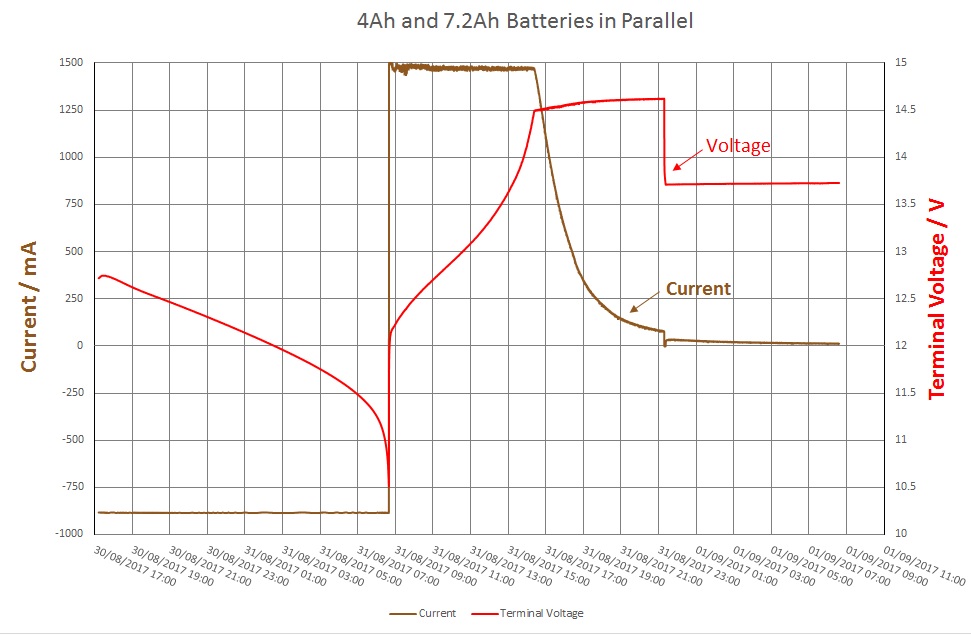
Fig 5 The current traces in fig 4 added to show the total current
Conclusions
Battery no 1 (nominally 7.2Ah) as a single battery gave 8.4Ah in the current configuration.
Battery no 2 (nominally 4 Ah) gave 4.22 Ah in the current configuration.
Because of the constant current operation, the total charge current is identical whatever size of battery is connected.
As a parallel pair, the normal expectation would have been 12.62 Ah. In fact, the parallel pair gave slightly more at 13.73 Ah. This is because the current demand from each battery was lower and as a general rule as the output current drops the available Ah rises (Peukert's law).